
Manhattan Market Update
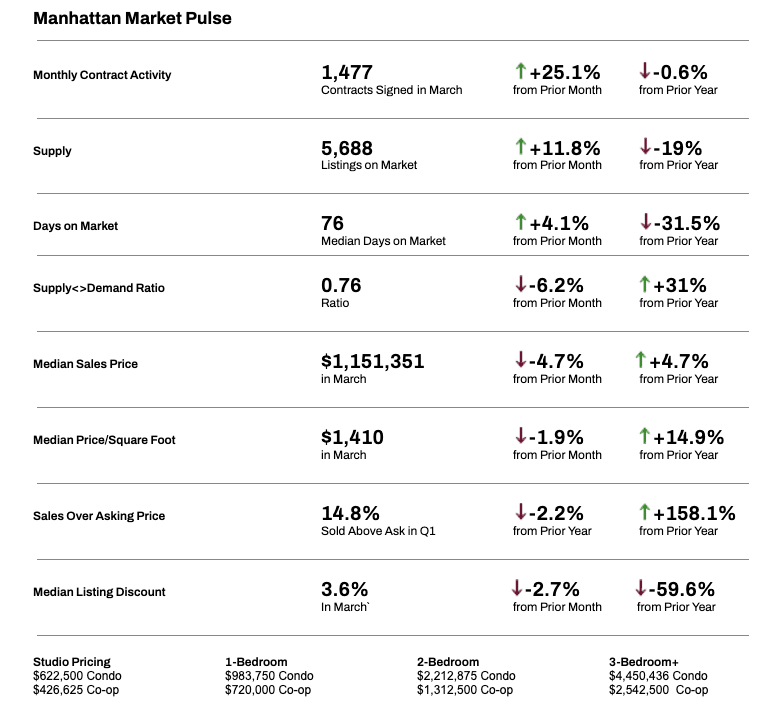
In March, contract activity increased 25% compared to February, as 1,477 contracts were signed. Supply also increased, up nearly 12% compared to last month as a record-setting 2,440 new homes came on the market. This new-to-market- supply is met with eager-to-transact buyers who are quickly absorbing the inventory. Overall supply is being kept in-check by the persistently strong buyer demand, and inventory is turning over rather quickly. Homes are going into contract in 76 days on median, 4% longer than last month, but 32% quicker than this time last year. Median sales prices have come down slightly from last month, but are higher on an annualized basis. The bulk of the recent price appreciation can be attributed to the strength of the luxury market, which is boosting the median, and the market may be in for a short-term peak in prices, as indicators hint at a slowdown of the luxury segments. Regardless, rising interest rates, which are rising at the fastest rate in decades, are accelerating some buyer demand. Coupled with headlines pronouncing the strength of the Manhattan real estate market, buyers may be having a FOMO moment and feeling intrinsic and extrinsic pressure to transact sooner.
Manhattan Supply
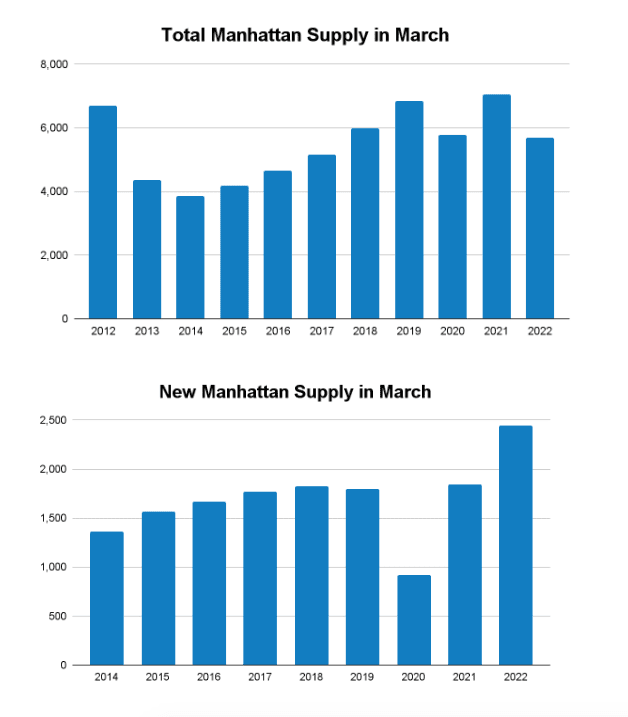
Total supply increased in March as nearly 2,500 new listings came to market in the month, increasing total supply by 12% to 5,688 units available for sale. Although more listings came to market this March than in any of the ten preceding March’s, seasonally adjusted total supply is at the lowest level since 2017. Compared to last year, supply has decreased by 19%. Overall supply is tamped down because of the continued strong buyer demand, which is turning the inventory over quickly.Note: “Total Supply” refers to the amount of inventory on the market at a given time. “New Supply” or “New-to-Market” refers to the amount of new inventory that came on the market in a specific time period.
INVENTORY: Key Takeaway
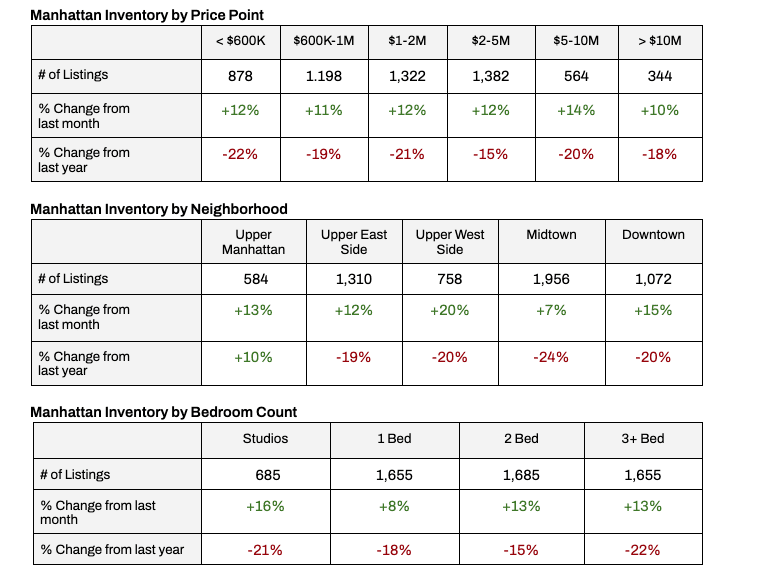
- Compared to last year there is less inventory across all price ranges, neighborhoods and apartment sizes,
- Compared to last month, inventory increased across all market segments.
- In the last month, inventory increased the most on a percentage basis on the Upper West Side, out of all the neighborhoods.
- In the last month, inventory increased nearly uniformly on a percentage basis across all price ranges.
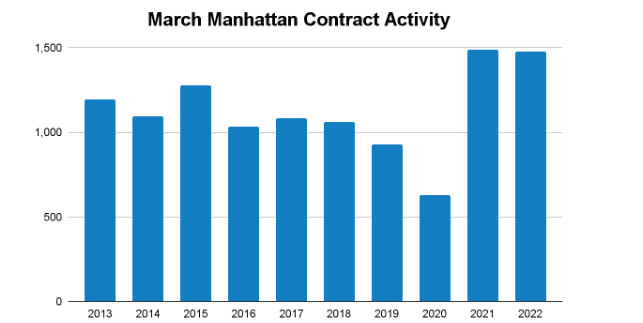
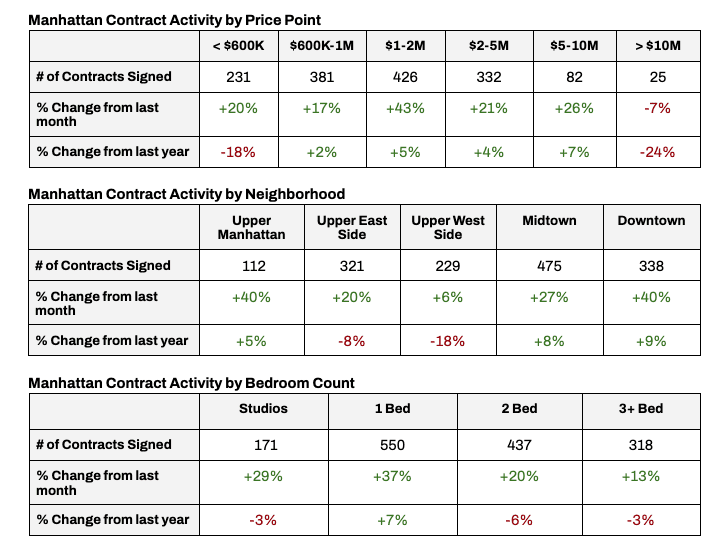
Manhattan Buyer Activity as measured by signed contracts, remained very high for the month of March, with 1,477 contracts signed, virtually the same number as March 2021 when 1,486 contracts were signed. Contract activity increased 25% from February and decreased half a percent from last year. This marks two years in a row with contract activity well above average, and has been a key reason why supply has been trending lower, despite above-average levels of new-to-market supply.
CONTRACT ACTIVITY: Key Takeaways
- Compared to last month, contract activity increased across all price ranges, neighborhoods and apartment sizes except for the $10M+ price range.
- In the last month, apartments priced between $1–2M had the largest percentage increase in contract activity.
- In the last year contract activity increased in Midtown, Downtown and Upper Manhattan, while it decreased on the Upper East and Upper West Sides.
- In the last month, on a percentage basis, contract activity increased the most for 1-bedroom homes.
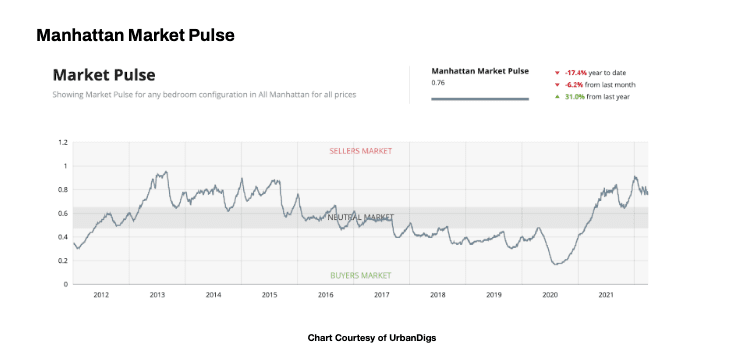
Manhattan’s Market Pulse [a ratio between pending sales and supply] decreased by 6% in March as supply increased and pending sales decreased. The current Market Pulse is 0.76, still indicative of a seller’s market, and is 31% higher than a year ago. Despite the recent drop in the Market Pulse, the median listing discount is also decreasing, down 2.7% from last month and 60% from last year to 3.6%. Additionally, nearly 15% of sales sold for over the asking price in Q1 2022, which is 158% more than in Q1 2021.
A Market Pulse below 0.4 is considered a buyer’s market, a Market Pulse between 0.4 and 0.6 is considered a neutral market and a Market Pulse above 0.6 is considered a seller’s market.] In a seller’s market, sellers often have more leverage than buyers because demand is greater than supply, resulting in apartments selling quickly, fewer discounts and increased bidding wars.
MARKET PULSE: Key Takeaways
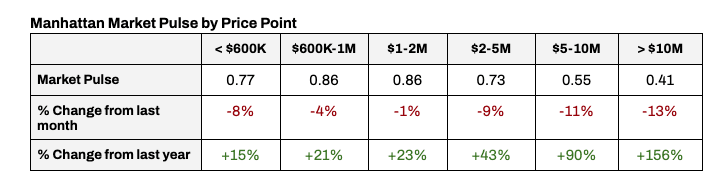
- In the last month, the Market Pulse decreased across all price ranges, neighborhoods and bedroom counts, except for the Upper East Side and Midtown, where it remained unchanged.
- Over the last year, the Market Pulse increased across all price ranges, neighborhoods and bedroom counts, except for Upper Manhattan.
- The Market Pulse remains the highest for apartments priced under $2M, but is also very high [leverage favoring the seller] for apartments priced $2–5M.
- The Market Pulse for $5–10M and $10+M decreased the most on a percentage basis in the last month, down 11% and 13% respectively.
- The Upper West Side is the neighborhood with the highest Market Pulse followed by Downtown, while Upper Manhattan continued to have the lowest.
Pricing & Discounts
The Median Sales Price across Manhattan for the month of March was $1,151,351, a decrease of nearly 5% compared to February and an increase of nearly 5% compared to last year. On a price per square foot (PPSF) basis, the Median PPSF is $1,410, a decrease of 2% from the previous month and an increase of 15% compared to last year. The continued strength of the luxury market is one reason why the price increases are as high as they are, however, early indicators hint that the luxury market resurgence may be running its course. The market may be seeing a short-term peak of prices as the market reassesses the current rising interest rate environment, geopolitical situations and choppy equity markets. Regardless of prices, the market still feels very competitive for buyers, which is resulting in homes continuing to sell quicker than normal and for a higher percentage of the asking price. The median listing discount is currently 3.6% with nearly 15% of homes having sold over the asking price in Q1 2022.
PRICING: Key Takeaways
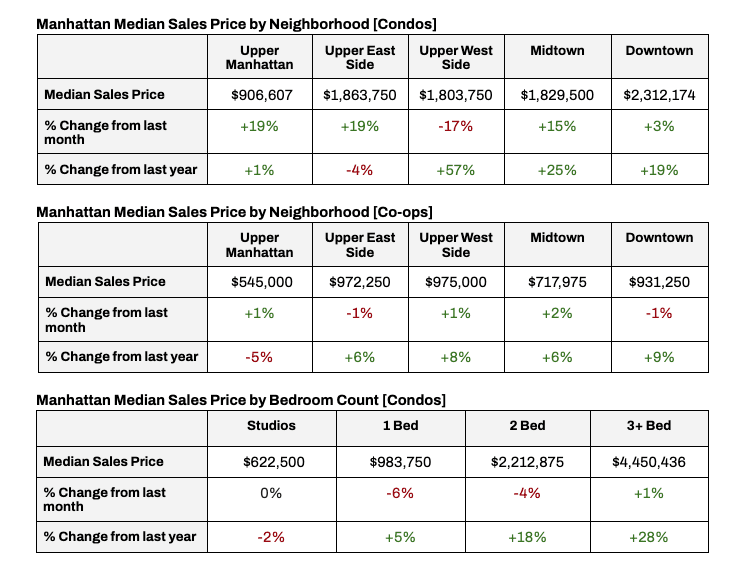
- In the last month, condos in Upper Manhattan and on the Upper East side saw the largest percentage increase in median sales price, up 19%, followed by condos in Midtown with a 15% increase.
- In the last month, coops saw much smaller changes in median sales price, with all neighborhoods remaining relatively flat, either up or down 1%.
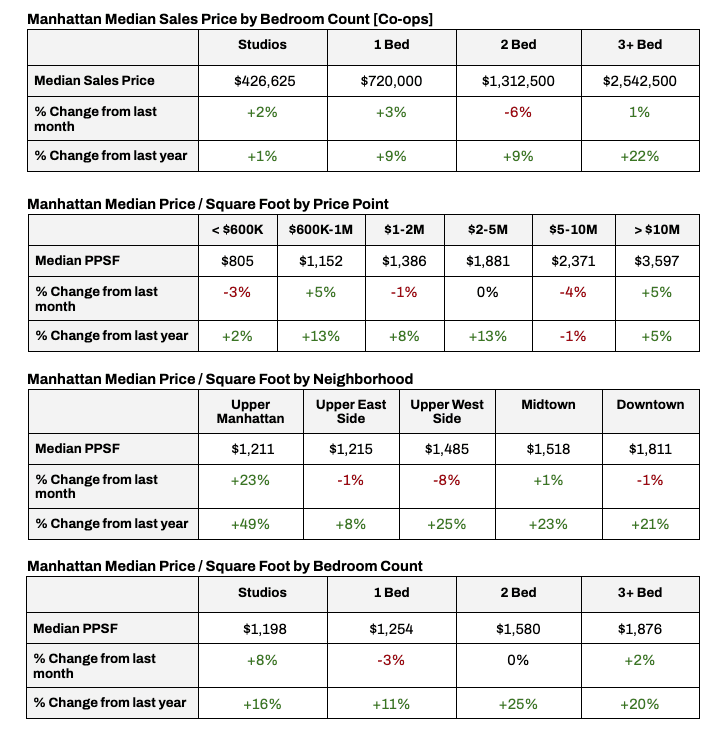
- By price per square foot, condos in Upper Manhattan saw a 23% increase in the last month, reflective of some recent higher-priced new development projects closing, which skews the statistics.
- The median price per square foot rose for homes priced between $600K-$1M and $10M+ in the last month.
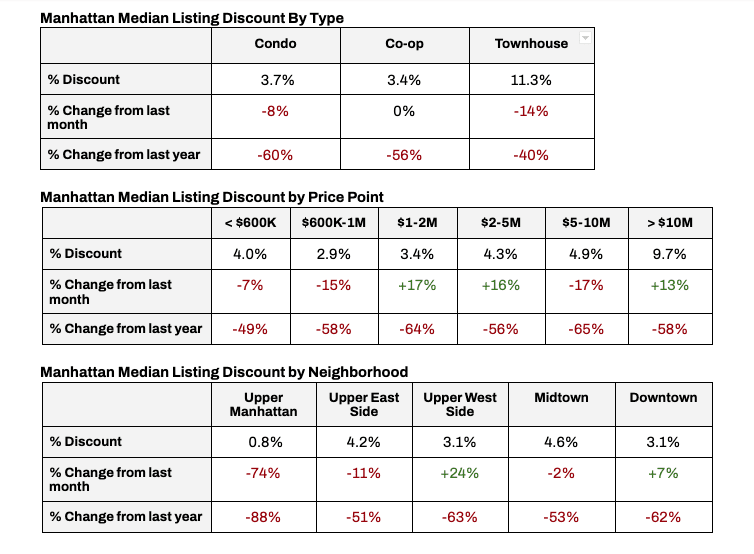
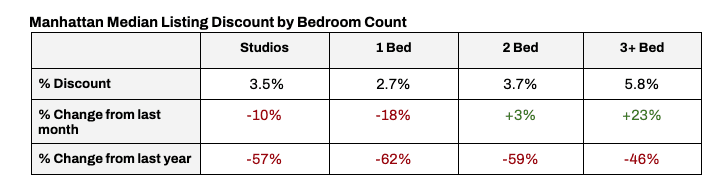
MEDIAN LISTING DISCOUNT: Key Takeaways
- The median listing discount decreased for condos and townhouses in the last month, while it remained unchanged for co-ops.
- The median listing discount increased for homes priced $1–2M, $2–5M and $10M+, while it decreased for homes priced under $600K, $600K-1M and $5–10M in the last month.
- In the last month, the Upper West Side and Downtown saw an increase in the median listing discount, while all other neighborhoods experienced a decrease.
- In the last year, the median listing discount decreased across all market segments.

What this means for…
Buyers:
- Buyers are facing compounding pressure, from rising mortgage interest rates, limited inventory, rising prices and continued strong buyer demand.
- Mortgage rates are increasing at the fastest pace in decades, accelerating the plans for some buyers.
- Ample new supply is coming on the market this spring, offering new options for buyers, and buyers need to be ready to compete with other ready-to-transact buyers.
- Given rising rents and current inflation, with a holding period of 3–5 [or more] years, buying may make more sense than renting today.
Sellers:
- Record setting new supply is coming to the market, increasing competition for sellers.
- Sellers need to read the market cues and readjust quickly if they are overpriced or mispositioned in the market
- Today presents a window of opportunity for sellers to come to market to take advantage of a confluence of market conditions creating pressure for buyers to transact sooner than later.
Renters:
- Covid-era rent discounts are a thing of the past, as renters experience rapid price increases which are erasing prior discounts and landlord concessions.
- Rents are now back in-line with the increasing trend of the last 5-years.
- Competition remains fierce amongst tenants, with apartments often receiving multiple offers and frequently going to bidding wars.
- Supply continues to trend downward heading into the spring and summer rental market as tenants may choose to renew rather than compete in the rental market and move.
Investors:
- Rising interest rates should have a more muted effect in Manhattan, as Manhattan is less leveraged than most of America, enabling the NYC market to withstand the pressures of ascending interest rates better than many other national markets.
- Leveraged investors, who have a lower interest rate locked in stand to benefit from the inflationary pressures and rising rental rates. Those investors should continue to hold and experience rising cap rates in the years to come.
Please contact us if you would like to learn more.